

US equity leadership remains intact
- 08.14.26
- Markets & Investing
- Commentary
Review the latest Weekly Headings by CIO Larry Adam.
Key takeaways:
- The US economy is on track to grow nearly three times the eurozone’s GDP
- US earnings growth has outpaced Europe’s for 12 consecutive quarters
- The US has greater exposure to sectors that drive growth, earnings and innovation
For over two decades, US equities have been the global market leader, outperforming the Stoxx Europe 600 by an astonishing approximately 530%. While Europe’s recent comeback has narrowed the gap, the forces underpinning US leadership remain firmly intact. Below, we revisit the case for US versus European equities and reiterate why we maintain our preference for US equities.
The US economy remains the brightest star
The US economy is on track to grow by 2.3% this year, over three times the eurozone’s expected 0.7% pace. While Europe has proven more resilient than many feared amid energy and tariff-related headwinds, a meaningful growth gap with the US is likely to persist. The US continues to benefit from structural advantages that are difficult to match, including global technology leadership, flexible labor markets, stronger productivity growth and deeper capital markets. Those strengths are increasingly evident in the rapid expansion of AI infrastructure and semiconductor capacity, which continue to fuel investment and economic activity. Meanwhile, the US consumer remains a powerful growth engine, accounting for nearly two-thirds of GDP. By contrast, eurozone growth continues to face headwinds from aging demographics, a more cautious consumer, regulatory burdens and economic and political fragmentation. As a result, we expect the US to maintain a meaningful growth advantage over Europe.
US earnings still outshine Europe
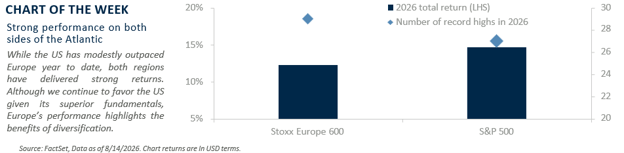
While the Stoxx Europe 600 has only modestly trailed the S&P 500 this year, US corporate fundamentals remain stronger. Despite a renewed energy supply shock, Europe is delivering its strongest earnings growth since 3Q22, with 2Q26 earnings per share (EPS) up 17.7% year over year. Even so, S&P 500 earnings growth remains ahead, outpacing Europe for a 12th consecutive quarter and by the widest margin (+32%) since 2Q20.
While some of the recent strength reflects private investment revaluations, US earnings leadership remains intact excluding these one-time gains. Ex these effects, the S&P 500 has posted higher beat rates (85% vs. 55%), larger earnings surprises (11% vs. 4%), and stronger upward revisions to 2026 estimates since the start of 3Q (+2.6% vs. +1.6%).
Looking ahead, with 2026 US profit margins (approximately 16%) about 50% higher than Europe’s, we expect US EPS growth to outpace Europe in both 2026 and 2027. While Europe’s earnings backdrop has improved, stronger momentum and higher profitability continue to favor US equities over the next 12 months.
Europe’s valuation edge has faded
Valuation has long been the strongest argument for European equities, though not one we have found compelling enough to outweigh the S&P 500’s fundamental advantages. In 2024, for example, the Stoxx Europe 600 traded at an approximately 40% discount to the S&P 500 on a forward basis, near its widest discount in at least three decades. However, following Europe’s catch-up rally in 2025, outperforming the S&P 500 by +18.9% in USD terms, that valuation advantage has narrowed considerably.
Today, Europe trades at an approximately 26% discount to the S&P 500, its narrowest level in four years and in line with its 10-year average. Importantly, the narrowing gap reflects both Europe’s re-rating and multiple compression in the US despite resilient economic growth and earnings. Moreover, on a price/earnings-to-growth basis, which adjusts valuations for expected earnings growth, the S&P 500 is less expensive on both a 2026 and 2027 basis. While Europe still trades at a discount that is largely justified by its structurally lower growth profile, we have not viewed that discount as sufficient to offset the S&P 500's superior growth, earnings and profitability. With the valuation gap now narrower, that case is even less compelling.
Sector spotlight favors the US
Year to date, European equities have benefited from higher energy and commodity prices given the index’s greater exposure to those sectors (approximately 6% vs. approximately 3% in the US). However, as energy markets normalize, that tailwind is likely to fade.
Meanwhile, with AI-related investments expected to remain a key market theme over the next 12 months, sector composition should favor the US, where technology-related companies account for approximately 50% of the S&P 500 versus just 11% in Europe. Moreover, tech and our other preferred sectors – industrials, health care and consumer discretionary – represent 64% of the S&P 500 compared with 47% in Europe. With greater exposure to the sectors driving growth, earnings and innovation, the S&P 500 remains better positioned to lead.
Bottom line
International investing is not an all-or-nothing decision. While diversification matters and European equities offer a higher dividend yield than the US (3.3% vs. 1.3%), we continue to favor an overweight to the US and an underweight to Europe.
All expressions of opinion reflect the judgment of the author(s) and the Investment Strategy Committee and are subject to change. This information should not be construed as a recommendation. The foregoing content is subject to change at any time without notice. Content provided herein is for informational purposes only. There is no guarantee that these statements, opinions or forecasts provided herein will prove to be correct. Past performance is not a guarantee of future results. Indices and peer groups are not available for direct investment. Any investor who attempts to mimic the performance of an index or peer group would incur fees and expenses that would reduce returns. No investment strategy can guarantee success.
Economic and market conditions are subject to change. Investing involves risks including the possible loss of capital.
The information has been obtained from sources considered to be reliable, but we do not guarantee that the foregoing material is accurate or complete. Diversification and asset allocation do not ensure a profit or protect against a loss.
The S&P 500 Total Return Index: The index is widely regarded as the best single gauge of large-cap U.S. equities. There is over USD 7.8 trillion benchmarked to the index, with index assets comprising approximately USD 2.2 trillion of this total. The index includes 500 leading companies and captures approximately 80% coverage of available market capitalization.
Sector investments are companies focused on a specific economic sector and are presented here for illustrative purposes only. Sectors, including technology, are subject to varying levels of competition, economic sensitivity, and political and regulatory risks. Investing in any individual sector involves limited diversification.
